What does it take to prove that you don't have good cell service?
Table of Contents
Recently, the U.S. Federal Communications Commission (FCC) established a process by which consumers can demonstrate that, contrary to what their carrier claims, they don’t have adequate cell service in a specific geographical area. In other words, you can prove that Verizon (or whatever carrier you use) really does have terrible service in your neighborhood despite what their coverage maps say.
This whole process is rather complicated, though, and it’s primarily explained in official FCC documents that are long, boring, and sometimes difficult to understand. We’ve gone through those documents in the process of creating CellWatch, and we have a pretty good understanding of how the process works. This post aims to serve as an overview of the process for people who don’t feel like combing through 100-page government publications.
If you want to stay up-to-date on CellWatch or have feedback about how we could help streamline the FCC challenge process for consumers, email Jason Cox at jcox99@gatech.edu.
Background
As a cell phone user, you probably hope to have good service everywhere so that you can connect to online services. Two of the key metrics that determine whether the cell service is “good” are download speed and upload speed. Download speed measures how quickly your device can receive data from the Internet, such as when you load a website or stream a video. Upload speed measures how quickly your device can send data to the Internet, such as when you post a picture on social media or send an email to your boss.
How fast is fast enough?
What constitutes a “good” download or upload speed varies depending on what you’re trying to do. (Internet speeds are typically measured in megabits per second (Mbps) or kilobits per second (kbps) – 1 Mbps equals 1000 kbps.) Activities that don’t use much data, like viewing a simple webpage (download) or sending an email without attachments (upload), typically work just fine with less than 1 Mbps. Other activities may be more demanding; Zoom recommends at least 600 kbps download and 1 Mbps upload for a group video call, with higher requirements to get better quality video, and Netflix suggests at least 5 Mbps download to stream a movie in full HD (1080p). Doing multiple things at once, like downloading an app while watching a video, increases the speed you need.Since speed is such an important indicator of service quality, the FCC requires cellular carriers, such as Verizon and AT&T, to publish maps indicating where they provide coverage that meets certain speed thresholds. These maps, which you can view online, are useful for helping consumers choose which carrier to sign up with, informing infrastructure investment decisions, and evaluating carriers’ “we cover everywhere” advertising claims. However, the maps have been widely criticized for their inaccuracies. As a result, in 2020 the U.S. Congress passed the Broadband DATA Act, which requires that the FCC establish a process by which the carriers’ maps may be challenged.
Per this new challenge process, you can run speed tests on your phone and submit the results to the FCC. When you submit enough data to prove that you aren’t getting the speeds advertised in your carrier’s maps, your carrier will be required to either rebut your challenge with their own data or update their maps to show that the area that you challenged is not covered.
Why are existing coverage maps inaccurate, and why do we need speed tests to prove it?
Cell carriers create their coverage maps using complex mathematical models based on where their cell towers are, how many phones will connect to the towers at any given time, and how well wireless signal carries over space, among other factors. In other words, they’re doing some intelligent estimation. That estimation is difficult for many reasons; for example, path obstructions (e.g., a tree between your phone and the cell tower), congestion (i.e., how many phones are trying to communicate with the cell tower at the same time), and even weather can all have a significant effect on the quality of the wireless connection and thus on the download and upload speeds you experience. What’s more, providers are incentivized to estimate generously because they know that cell phone users consider coverage when selecting a carrier.
Since the estimates will never be entirely accurate, the best way to know what service is like at a given location is to go there and try it out. Even better is to try it out several times, with different devices and at different times. The FCC’s challenge process is designed to use several of these real-world measurements to get a good idea of the service quality in an area.
Challenge dimensions
The coverage maps are separated on a number of dimensions:
- Provider: The cellular carrier providing service, such as Verizon or T-Mobile. Since different providers operate different cell towers, an area may be covered by one provider but not by another.
- Environment: The phone’s setting when connecting to the tower, defined by the FCC as either outdoor stationary or in-vehicle mobile. Wireless communication typically works better when the cell phone isn’t moving, so it makes sense to differentiate. Obstructions, such as walls, also affect the quality of wireless communication, so the maps only indicate what kind of coverage you can expect when outside.
- Technology: The wireless communication technology with which your phone and the cell tower communicate, such as 3G, 4G LTE, or 5G. Newer technologies, like 5G, are capable of much higher speeds than older technologies, like 3G. However, not all towers are equipped for all technologies, and the maximum distance between the tower and the phone varies by technology, so an area may be covered by one technology but not by another. What’s more, not all phones are capable of all technologies, so it’s useful to break the map down accordingly.
- Speed: The minimum download and upload speed that a provider claims. The FCC sets certain speed thresholds, which vary based on the cellular technology used, and the coverage maps indicate where service is good enough to guarantee that those thresholds are met most of the time. Most technologies only have a single speed threshold, but 5G has two; the maps can indicate that one area is capable of fast 5G service while another is only capable of slower 5G service.
As a result of this separation, challenges to the coverage maps are specific to a certain combination of the dimensions. Additionally, a challenge is specific to a certain data transfer direction, i.e., download or upload. For example, you might challenge Verizon’s outdoor stationary 4G LTE map that claims a minimum download speed of 5 megabits per second (Mbps), but that challenge would not dispute Verizon’s claimed 5G coverage in the same area or even their 4G LTE upload speeds.
One important exception is that a challenge to a provider’s claimed outdoor stationary coverage will also count as a challenge to their claimed in-vehicle mobile coverage. This caveat exists because stationary coverage is typically better than mobile coverage.
Challenge regions
Additionally, since service quality varies by location, challenges are specific to a certain geographic region. Regions are defined by the H3 system, which uses a nested hierarchy of hexagons in which each hexagon of resolution r contains seven child hexagons of resolution r + 1.

The blue hexagon contains 7 purple hexagons, each of which contain 7 green hexagons.
The FCC has determined that challenges are to be made against resolution-8 hexagons, which are relatively small; each has an area of about 0.7 square kilometers. You might successfully challenge the advertised speeds in your neighborhood, but additional data would be required to also challenge the speeds a few blocks away.
Useful terms
The following terms will be used throughout this post and may need a bit of explanation:
- accessible: A region is considered accessible if it contains at least one road and the provider claims to cover at least 50% of it for the technology, environment, and direction being challenged.
- carrier: The company providing you with cell service, such as Verizon or AT&T.
- challenge: A set of speed test data used to claim that a carrier is not providing the level of service they claim to provide. Sometimes called a cognizable challenge to indicate that the data is sufficient for the FCC to make the carrier do something about the challenge.
- direction: The direction of data transfer – either upload or download.
- environment: The setting in which a test is conducted – either outdoor stationary or in-vehicle mobile.
- hexagon: A hexagonal region, as defined by the H3 system.
- minimum speed: How quickly a provider claims to be able to move data from the Internet to a phone (download) or from a phone to the Internet (upload). Typically measured in megabits per second (Mbps).
- negative test: A speed test which found that the relevant speed (upload or download) did not meet the provider’s claimed minimum.
- positive test: A speed test which found that the relevant speed (upload or download) did meet the provider’s claimed minimum.
- provider: See carrier.
- region: See hexagon.
- technology: A specific cellular technology, such as 3G, 4G LTE, or 5G.
- test: A speed test. Tests typically include both an upload speed measurement and a download speed measurement, but when including tests in a challenge, either the upload or download component is included, not both.
Which areas are eligible for a challenge?
Any area that a provider claims to cover with a given combination of technology, environment, direction, and speed can be challenged for that combination.
When attempting to challenge a provider’s claimed coverage, you’ll need to identify a specific region to challenge. Challenges primarily take place per resolution-8 hexagon in the H3 system; additionally, the larger resolution-6 and 7 hexagons can be challenged by challenging four or more of their seven child hexagons. Resolution 0-5 or 9-15 hexagons cannot be challenged.
Also, in order to be eligible, a region must not have had a recently rebutted challenge. A challenge is considered rebutted if, after being notified of the challenge, the provider collects and submits their own data proving that the challenged area does in fact have sufficient coverage. An area may not be re-challenged if it had a rebutted challenge within six months of the most recent broadband filing. (Filings occur twice a year, so an area with a rebutted challenge will be ineligible for between 6 and 12 months.)
How do you run speed tests?
The easiest way to run speed tests for a challenge is by using an FCC-approved mobile app. Currently, I’m only aware of a single approved app – the FCC’s own app (available on Android and iOS). There is a process by which third-party apps can be certified for use, but none exist yet. (We’re working on one that aims to be much more user-friendly.)
Approved apps will automatically submit test results to the FCC as they are collected. As a user, all you need to do is download an app, provide your contact details (required by the FCC) and location permissions, and use it to run some speed tests. (In the FCC’s app, you’ll need to make sure that you choose to run a “Challenge Speed Test”, not just a normal “Speed Test”.)
Speed tests typically take between 10 and 30 seconds to run – it’s quick and easy.
How do you know if you’ve run enough tests?
In order to create a cognizable challenge – one that your provider actually has to do something about – you’ll need to run enough speed tests to meet the FCC’s requirements. The short version of those requirements is that you’ll probably need to run at least eight tests across four different locations and two different times of day.
The long version, of course, is more complicated. You’ll need to ensure that your tests are valid (e.g., taken outdoors between 6:00 AM and 10:00 PM) and that they satisfy certain geographic, temporal, and testing thresholds. The flowchart below provides an overview of these steps, each of which is described in more detail later in the post.
It’s important to note that the FCC will aggregate tests from all sources when considering whether a region is challenged. This fact means that it’s impossible to be entirely sure that you’ve collected enough data to create a cognizable challenge – the testing threshold requires that a certain percentage of tests within the region be negative, and you can’t calculate that percentage accurately unless you know about all of the tests for the region, including those run by others. I don’t expect to see tons of people submitting speed tests, though, so you can probably make a fairly confident assessment using only your test data.
Flowchart: Overview of what makes a cognizable challenge

Which tests are valid?
The FCC has outlined a few general requirements for a test to be eligible for inclusion in a challenge:
The test must have been taken within the last year.
The test must have been taken on the provider’s network directly. In other words, to challenge AT&T’s coverage maps, you need to take tests on a phone subscribed directly to AT&T (i.e., not through a mobile virtual network operator (MVNO) like Ting or Mint), and the tests must run over cellular data (not WiFi) while not roaming.
The test must have been taken between 6:00 AM and 10:00 PM local time.
The test must have been taken outdoors (in a vehicle counts).
Additionally, since challenges are specific to a combination of cellular technology, environment, and direction, there are a few more requirements:
The test must have been taken with the same combination of technology, environment, and direction being challenged.
The test must have been taken in a location that the provider claims to cover for that technology, environment, and direction.
There are a few possible exceptions to these requirements; the flowchart below shows the criteria in more detail.
Flowchart: Criteria for including a test in a challenge

Example: Evaluating validity of tests
Let’s say you’re trying to challenge T-Mobile’s 4G LTE stationary download speed in your neighborhood. You take the following tests:
| # | Date | Time | Positive | Provider | Tech | Environment | Direction |
|---|---|---|---|---|---|---|---|
| 1 | 8 Dec 2021 | 8:53 AM | no | T-Mobile | 4G LTE | stationary | download |
| 2 | 22 Jan 2022 | 9:47 PM | yes | T-Mobile | 4G LTE | stationary | download |
| 3 | 4 May 2022 | 5:15 AM | no | T-Mobile | 4G LTE | stationary | download |
| 4 | 11 Jul 2022 | 3:25 PM | yes | T-Mobile | 4G LTE | in-vehicle | download |
| 5 | 20 Nov 2022 | 12:50 PM | no | T-Mobile | 4G LTE | stationary | download |
| 6 | 24 Nov 2022 | 11:38 PM | no | T-Mobile | 4G LTE | in-vehicle | download |
| 7 | 3 Dec 2022 | 8:27 AM | no | T-Mobile | 4G LTE | stationary | upload |
| 8 | 11 Dec 2022 | 2:44 PM | yes | Ting | 4G LTE | stationary | download |
| 9 | 14 Dec 2022 | 8:41 AM | yes | T-Mobile | 4G LTE | stationary | download |
| 10 | 14 Dec 2022 | 10:31 AM | yes | T-Mobile | 5G | stationary | download |
Assuming that you are reviewing these measurements on 15 Dec 2022, only #2, #4, #5, and #9 are valid for inclusion in your challenge:
- #1 is invalid because it was taken more than a year ago.
- #2 is valid.
- #3 is invalid because it was taken before 6:00 AM.
- #4 is valid. Although it was taken in a moving vehicle, it can be counted towards a stationary challenge because it is a positive test, and it is assumed that stationary coverage is at least as good as in-vehicle coverage.
- #5 is valid.
- #6 is invalid because it was taken after 10:00 PM. Also, it was taken in a moving vehicle but was negative.
- #7 is invalid because it measured upload speed.
- #8 is invalid because it was not taken directly on T-Mobile’s network.
- #9 is valid.
- #10 is invalid because it was taken over 5G.
How do you know if you’ve met the geographic threshold?
In order to ensure that service is bad across an entire area, not just in a single location, the FCC requires that tests meet a geographic threshold. This requirement basically boils down to the fact that to challenge a region, you need to take at least two tests in four of its seven sub-regions, and one of those two tests must be negative in each sub-region.
Again, the process can be a bit more complex than that – check out the flowchart below for more details.
Flowchart: Determining if the geographic threshold is met

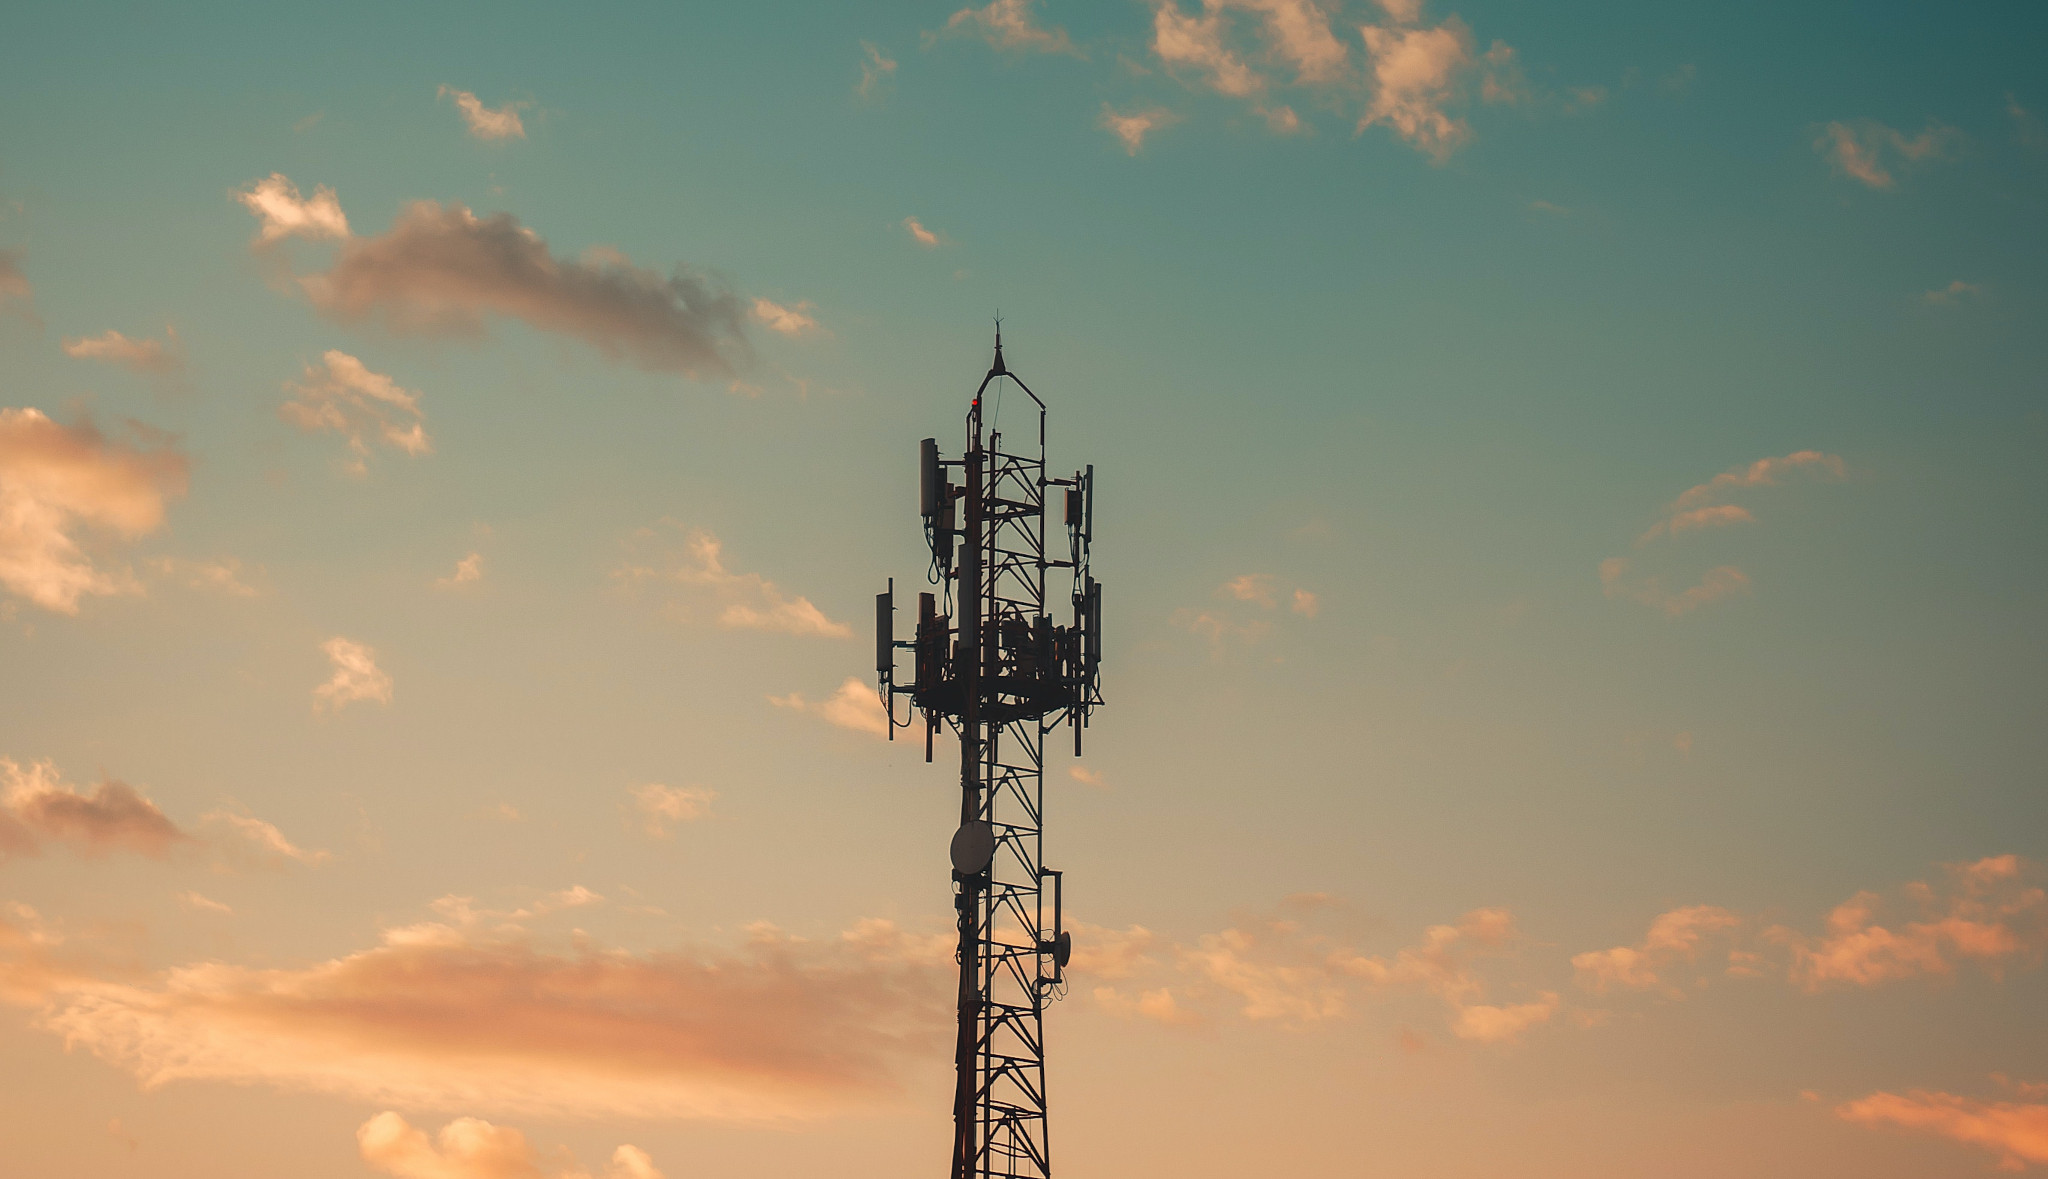
Example: Not quite meeting the geographic threshold
Consider the following resolution-8 hexagon. Although more of than four of its child hexagons contain tests, only three of the child hexagons contain at least two tests, one of which is negative. As a result, this resolution-8 hexagon does not meet the geographic threshold.
The purple hexagon is a resolution-8 hexagon being challenged, and the green hexagons are the resolution 9 child hexagons. Blue circles are positive tests, and red squares are negative tests. These hexagons are not accurately sized. Map © OpenStreetMap.
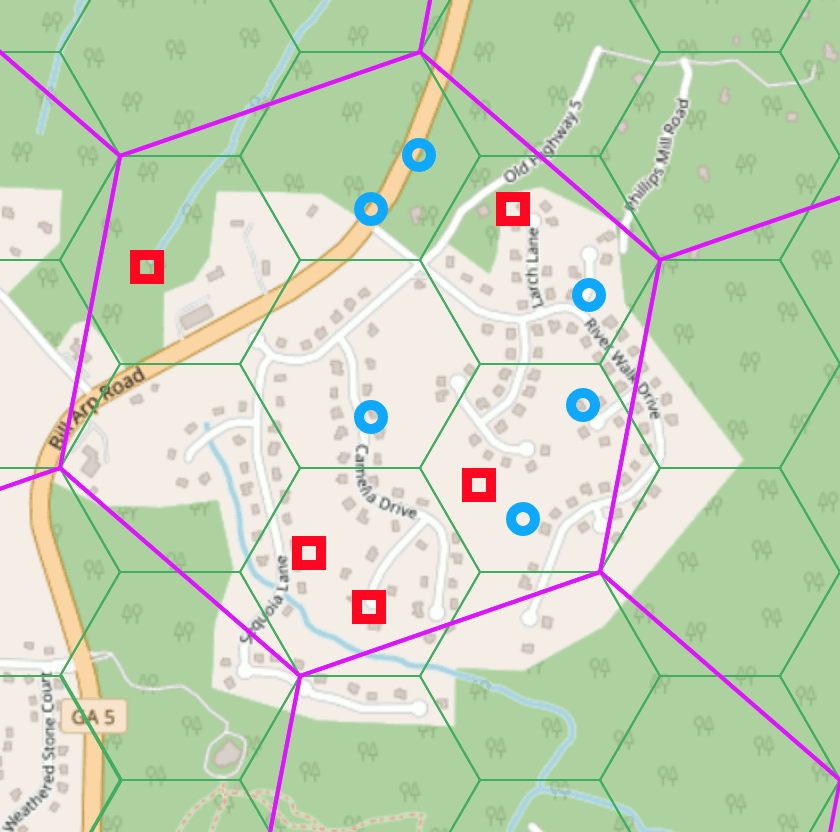
Example: Meeting the geographic threshold with fewer than four accessible sub-regions
Consider the following resolution-8 hexagon. Four of its child hexagons contain tests, but only three of them contain at least two tests, one of which is negative. However, since only three of the child hexagons are accessible (the rest don’t contain any roads), this hexagon still meets the geographic threshold.
The purple hexagon is a resolution-8 hexagon being challenged, and the green hexagons are the resolution 9 child hexagons. Blue circles are positive tests, and red squares are negative tests. These hexagons are not accurately sized. Map © OpenStreetMap.
How do you know if you’ve met the temporal threshold?
The FCC also wants to be sure that service is bad most of the time, not just at a single, particularly congested time of day. As a result, they require that tests meet a temporal threshold – the earliest two negative tests and the latest two negative tests (by time of day only, not date) must be at least four hours apart.
Flowchart: Determining if the temporal threshold is met

Example: Meeting the temporal threshold
Consider the following tests, ordered by date/time at which they were taken:
| # | Date | Time | Positive |
|---|---|---|---|
| 1 | 8 Jan 2022 | 8:53 AM | no |
| 2 | 22 Jan 2022 | 9:47 PM | no |
| 3 | 11 Jul 2022 | 3:25 PM | yes |
| 4 | 20 Nov 2022 | 12:50 PM | no |
| 5 | 3 Dec 2022 | 8:27 AM | no |
| 6 | 11 Dec 2022 | 2:44 PM | no |
| 7 | 14 Dec 2022 | 8:41 AM | yes |
| 8 | 14 Dec 2022 | 10:31 AM | yes |
To see if they meet the temporal threshold, we need to reorder them by time of day, ignoring the date:
| # | Date | Time | Positive |
|---|---|---|---|
| 5 | 3 Dec 2022 | 8:27 AM | no |
| 7 | 14 Dec 2022 | 8:41 AM | yes |
| 1 | 8 Jan 2022 | 8:53 AM | no |
| 8 | 14 Dec 2022 | 10:31 AM | yes |
| 4 | 20 Nov 2022 | 12:50 PM | no |
| 3 | 11 Jul 2022 | 3:25 PM | yes |
| 6 | 11 Dec 2022 | 2:44 PM | no |
| 2 | 22 Jan 2022 | 9:47 PM | no |
Here we can see that the two earliest negative tests, #5 and #1, were both taken at or before 8:53 AM. The two latest negative tests, #6 and #2, were both taken at or after 2:44 PM. Since 2:44 PM is more than four hours after 8:53 AM, these tests meet the temporal threshold.
How do you know if you’ve met the testing threshold?
Finally, in order to have a certain statistical level of confidence that service is indeed bad, the FCC requires enough tests to meet a testing threshold. This requirement essentially means that a certain percentage of the tests must be negative (around 20%, with the exact number varying based on the total number of tests taken) and that there must not be too many tests concentrated in a single sub-region of the region being challenged.
Take a look at the flowchart below for the exact details.
Flowchart: Determining if the testing threshold is met

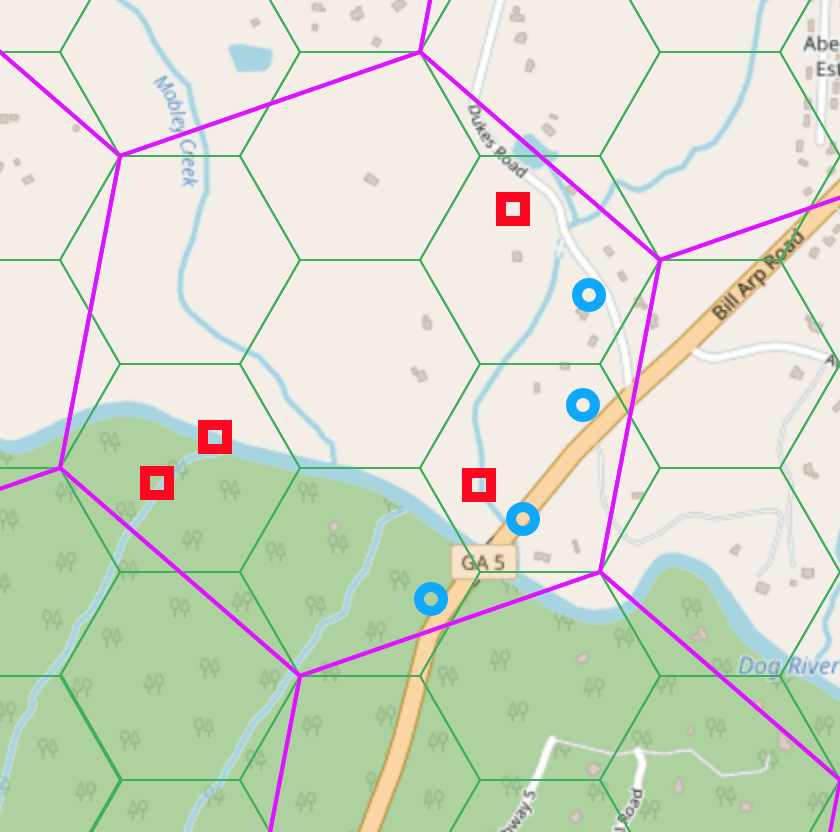
Example: Meeting the testing threshold
Consider the following resolution-8 hexagon. It has a total of 22 tests, 16 of which are positive and 6 of which are negative. That means that 27% of tests are negative, which meets the testing threshold for a hexagon with between 21 and 29 total tests.
The purple hexagon is a resolution-8 hexagon being challenged, and the green hexagons are the resolution 9 child hexagons. Blue circles are positive tests, and red squares are negative tests. These hexagons are not accurately sized. Map © OpenStreetMap.
Example: Not quite meeting the testing threshold due to concentration in a single child hexagon
Consider the following resolution-8 hexagon. It has a total of 31 tests, 24 of which are positive and 7 of which are negative. This ratio of 22.6% would normally be sufficient for a hexagon with between 30 and 45 tests, but in this case more than half of the tests are in a single child hexagon. As a result, the math gets a bit trickier because the child hexagon with more than half of the tests can only count towards half of the testing threshold.
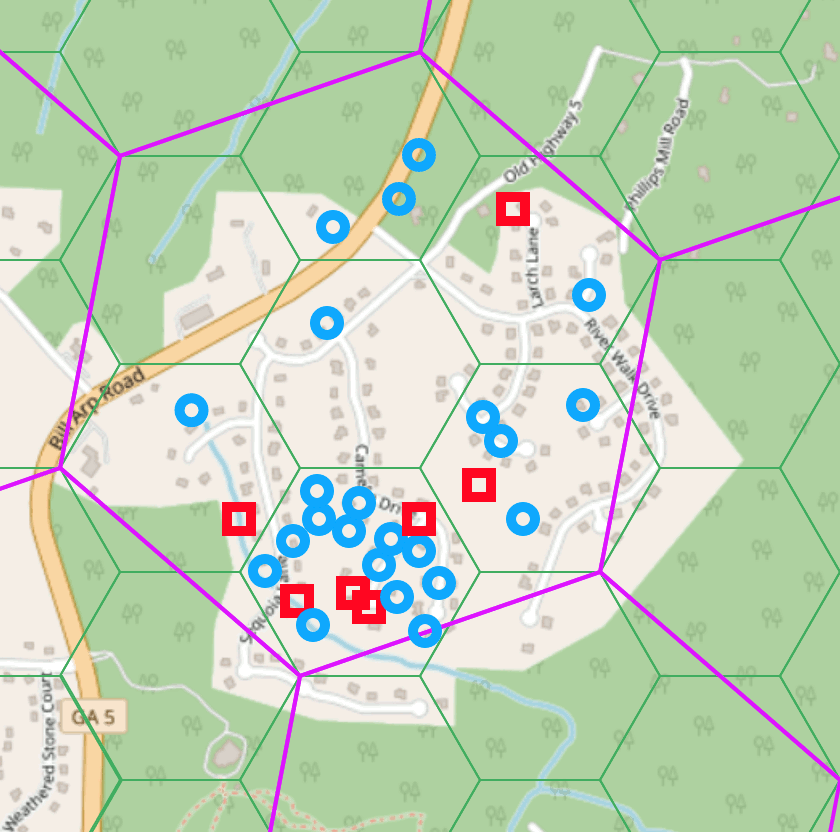
The purple hexagon is a resolution-8 hexagon being challenged, and the green hexagons are the resolution 9 child hexagons. Blue circles are positive tests, and red squares are negative tests. These hexagons are not accurately sized. Map © OpenStreetMap.
First, you need to compute the adjusted total number of tests by doubling the number of tests not in the child hexagon with the most tests:
(31 - 17) * 2 = 28
Then, you need to compute the adjusted number of negative tests in the child hexagon with more than half of the tests by multiplying the negative ratio for that child hexagon by half of the adjusted total number of tests computed above:
(4 / 17) * (28 / 2) = 3.29
Next, you add the adjusted number of negative tests computed above to the number of negative tests in the other child hexagons to get the total adjusted number of negative tests:
3.29 + 3 = 6.29
Finally, you compute the adjusted ratio of negative tests by dividing the adjusted number of negative tests by the adjusted total number of tests:
6.29 / 28 = 0.22 = 22%
With an adjusted total of 28 tests, you need at least 24% of tests to be negative, but the adjusted ratio of negative tests is only 22%, so the testing threshold is not met.
It’s complex but possible
The FCC’s challenge process is a bit complicated, but it is possible. If cell service is consistently bad in an area that matters to you, you might be able to challenge your provider’s coverage map with just two 15-minute measurement sessions.
If you want to stay up-to-date on CellWatch or have feedback about how we could help streamline the FCC challenge process for consumers, email Jason Cox at jcox99@gatech.edu.
Useful references
- The bulk of this information comes from the FCC’s Mobile Technical Requirements Order.
- The flowcharts included above are all available in one mega-flowchart of the full process.
- The H3 hexagon system has thorough documentation online.
- Details about the approval process for third-party speed test apps can be found in OET Bulletin 75.
- The FCC has a help center article explaining how to use their app to run speed tests for the challenge process.