Measuring cellular networks in New Mexico with a prototype CellWatch app
One piece of the CellWatch suite is a mobile broadband measurement app that measures the availability and quality of cell service. We’re developing CellWatch because mobile broadband access in rural and indigenous areas in the United States is insufficient and more measurement is needed to understand the extent and quality of mobile access.
To test out the capabilities of an alpha version of the CellWatch app, we went to New Mexico to take some measurements around Albuquerque and Santa Fe. Before going, we found some good places to measure by mapping out regions in these two cities using a benefit-to-cost algorithm that highlighted areas with few to no existing measurements. This algorithm considered four factors as inputs:
- Road access. Since we were traveling by car, it was important that we focused on areas containing roads.
- Tribal lands. Tribal lands make up a large portion of New Mexico, and since we didn’t have permission to measure on tribal lands, we designed our algorithm to avoid them.
- Number of existing measurements. We wanted to measure where there wasn’t any existing data, so we used Ookla’s mobile broadband dataset to locate areas with few or no existing measurements.
- Provider-reported coverage. Cellular providers report estimated coverage based on cell tower location, but this isn’t always representative of actual coverage. Our algorithm focused on areas near the edge of provider’s coverage claims as those areas are the most likely to be incorrectly classified in the providers’ coverage maps.
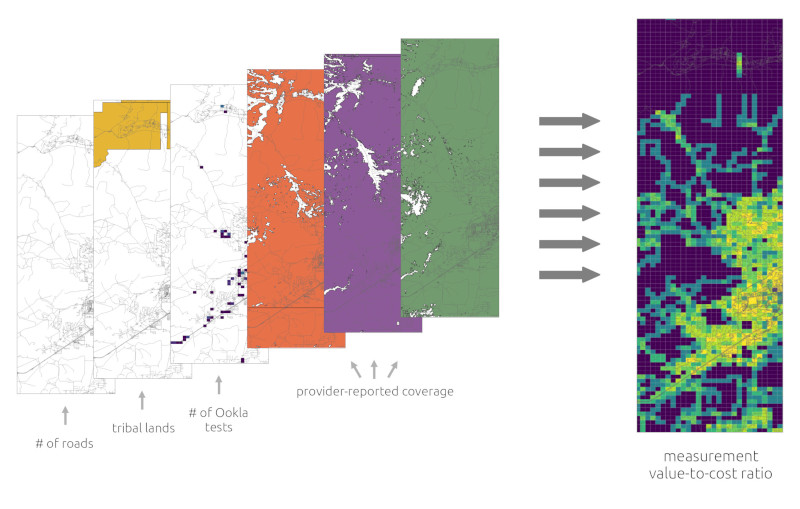
Maps showing the number of roads, the location of tribal lands, the number of Ookla tests, and provider-reported coverage were all combined to create a map of measurement value-to-cost ratio.
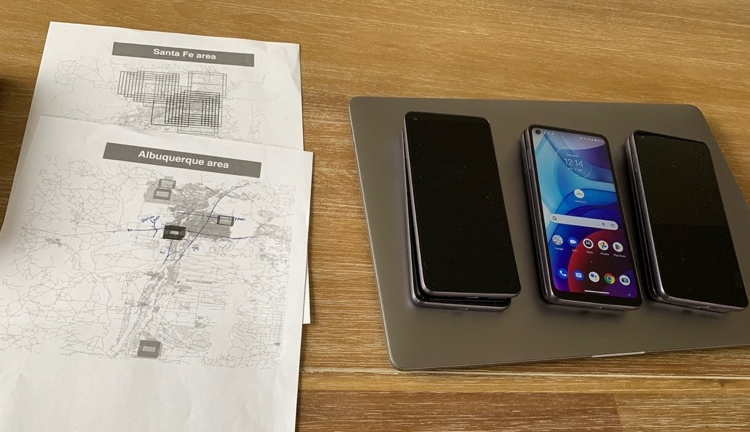
Once we’d identified several locations in which to collect measurements, we drove around New Mexico with nine phones – three for each of the major cellular providers (AT&T, Verizon, and T-Mobile).
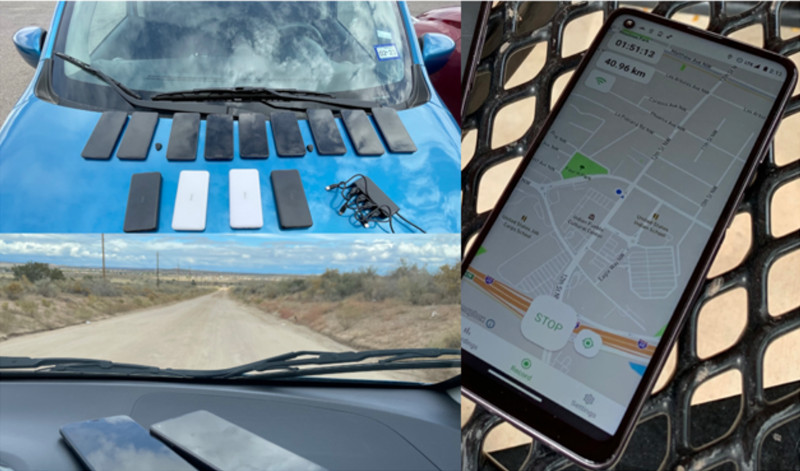
Documentation of our New Mexico measurement campaign: our nine research phones, four battery packs, and charging cables displayed on the rental car (top left); an active measurement recording outside of Albuquerque’s Indian Pueblo Cultural Center using our alpha-version Android app (right); a view of an unpaved road northwest of Albuquerque (bottom left).
In total, we traveled 40 miles in Santa Fe and over 55 miles in Albuquerque, logging over 7 hours of data collection. As a result, we collected 7,300 new signal strength measurements and 886 new upload/download speed test measurements! The red arrows in the images below show our upload/download speed test measurements, and the colored squares show the Ookla data; clearly some previously unmeasured areas were measured.
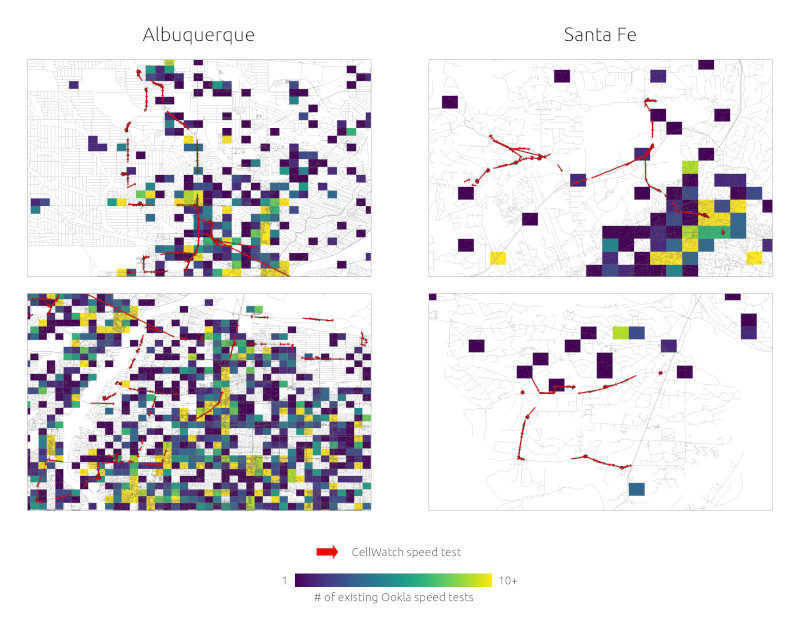
A comparison of the measurements we took (red arrows) and existing Ookla speed test data (colored squares). We successfully measured previously unmeasured areas in both Albuquerque and Santa Fe. (Our measurements are shown as arrows because they were taken from a moving car, so the start point and the end point were not always the same.)
Comparing our measurements to Ookla’s dataset, we can see in the charts below that Ookla tends to report higher speeds across the board. This discrepancy could be due to several factors such as Ookla’s closer server locations and different speed test methodology.
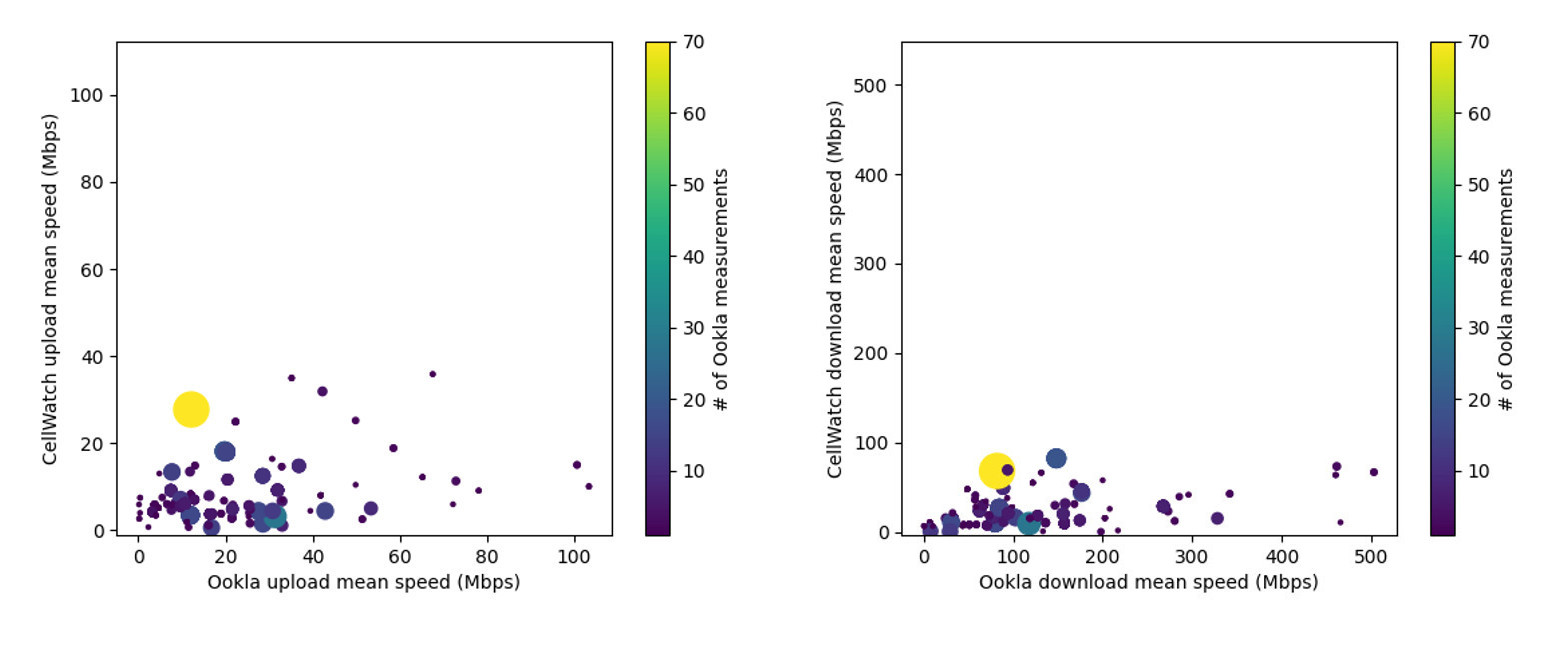
A comparison of CellWatch and Ookla upload (left) and download (right) speeds. Both color and size are used to show the number of Ookla measurements at a given speed.
We also plotted the upload and download speeds that we measured on a map to identify areas with and without connectivity. Below is one such map showing that none of the three major carriers provide great service where we measured in northwest Albuquerque, with T-Mobile typically performing better than AT&T and Verizon.
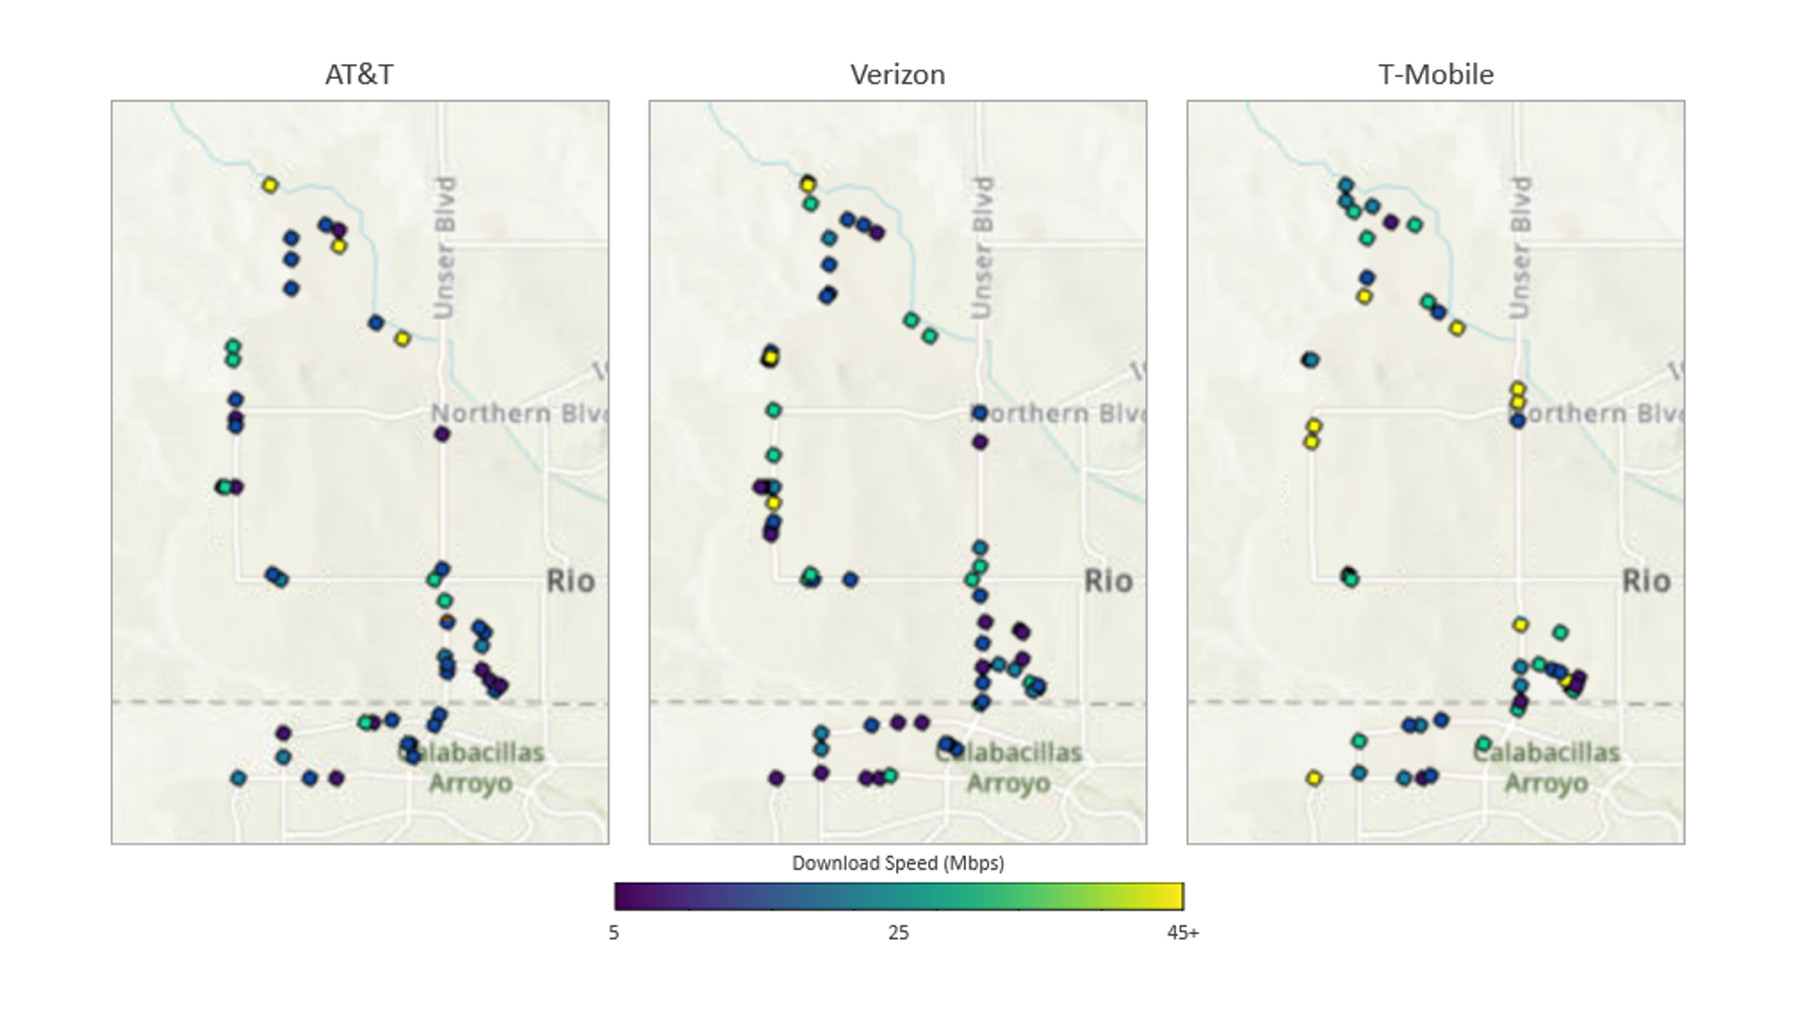
Individual CellWatch download speed measurements in northwestern Albuquerque, broken out by provider.
The measurements we collected in New Mexico were primarily intended to test out our app and experiment with some measurement planning algorithms, so we aren’t drawing any serious conclusions from the data. In the future, we hope to do additional targeted measurement trips and more in-depth data analysis.